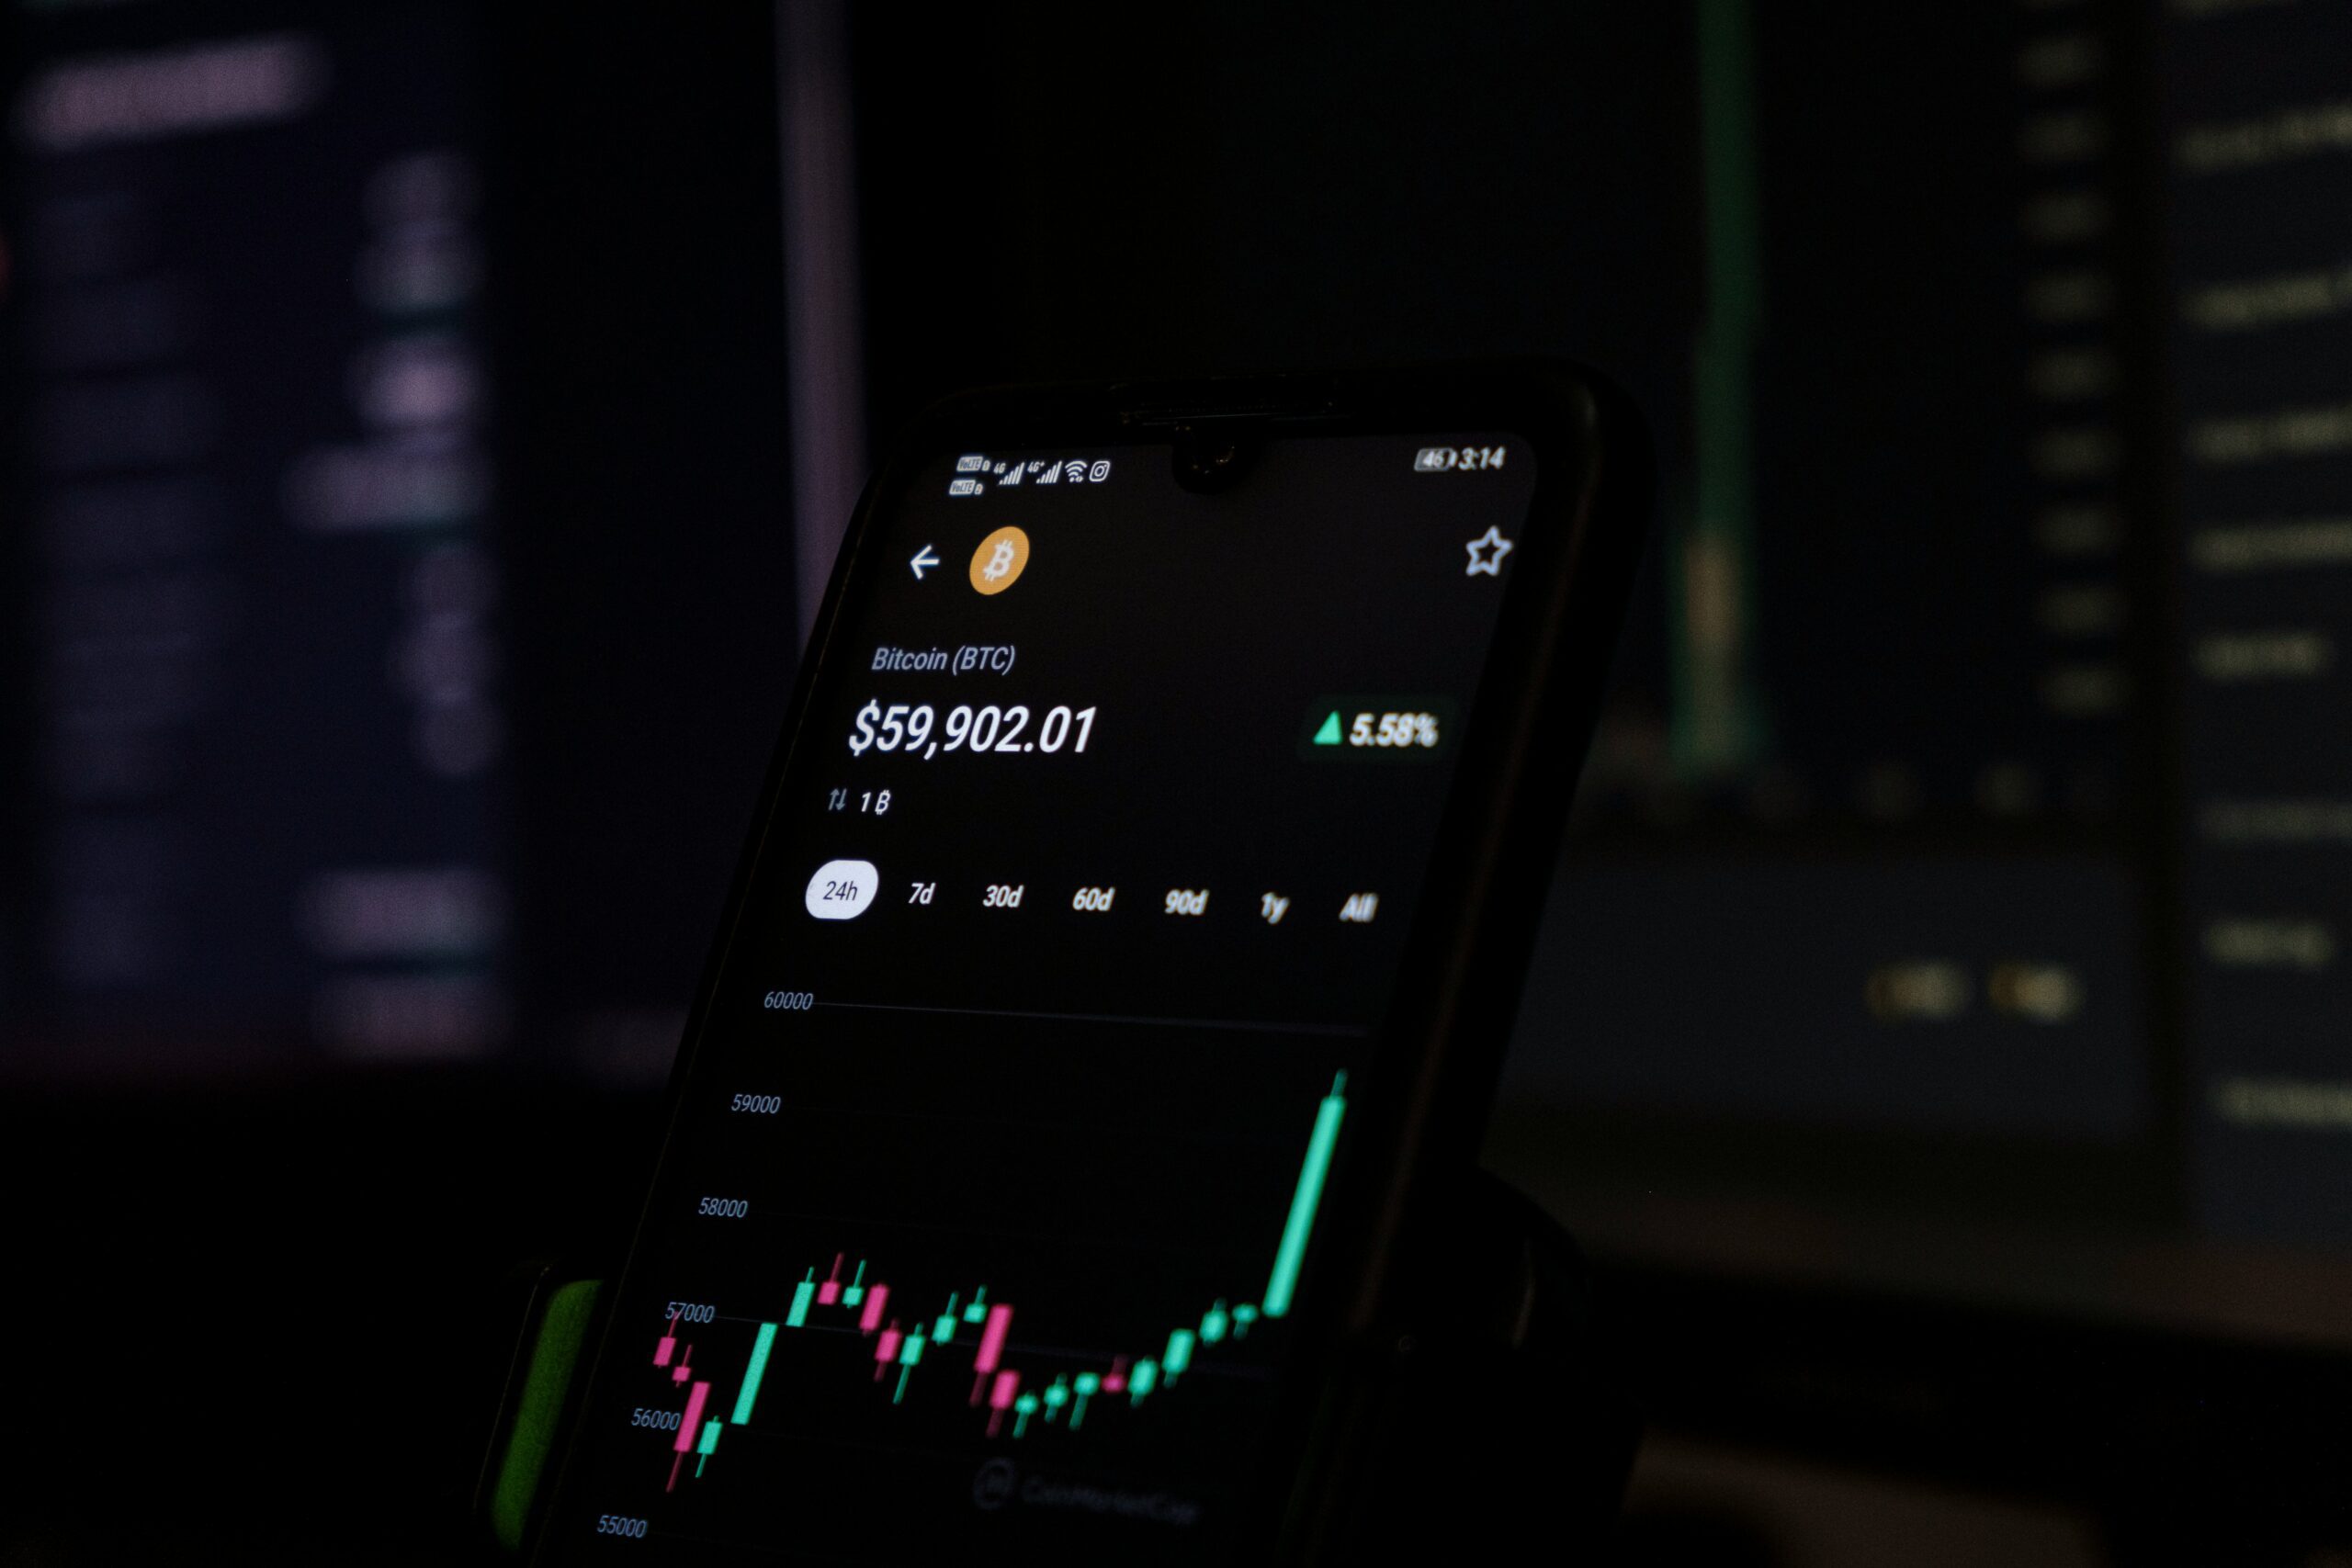
You are probably here because you are in the midst of a cryptocurrency bull market. An issue you might be facing is that you don’t know if you should be investing, you might have FOMO, or you’re wondering if you should stay clear in case you buy in at the top of a bubble.
Bitcoin Halving
In cryptocurrency a fundamental concept you should understand is that the cryptocurrency market for the most part follows Bitcoin. Bitcoin has the largest market cap and was the first cryptocurrency to be created which means that coins with a smaller market cap tend to trace it.
Because of how bitcoin was designed there is what is known as Bitcoin halvings. In order to keeps its value as a store of wealth, the reward for mining new blocks is halved every 4 years, or every 210,000 blocks. This makes it harder for Bitcoin miners to mine Bitcoin and thus directly affects the rate at which new Bitcoins are introduced into circulation impacting the overall supply of Bitcoin.
Bitcoin Price Cycle
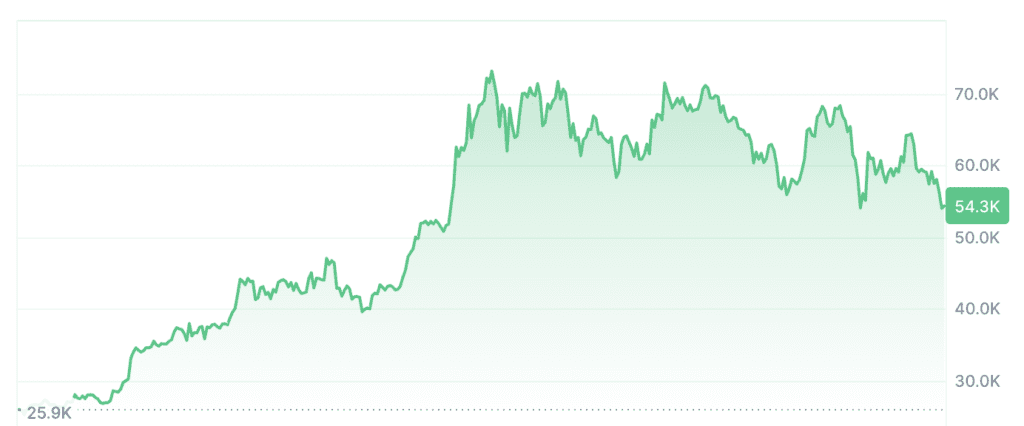
Due to Bitcoin halvings taking place over the last 13 years there is a phenomenon which is known as a Bitcoin price cycle, or Bitcoin halving cycle. 6 months before a Bitcoin halving, carrying on afterwards, the market becomes bullish and the price of Bitcoin rises substantially.
2024 is the first year where we see the cycle playing out slightly differently but there will be more on this further down.
After the Bitcoin halving takes place we usually see the market staying bullish for a further 15 months but the specific time will vary each cycle and we cannot know for certain how the market will move. Although, there are tools such as a Bitcoin Pi Cycle Top Indicator which help us predict the peak of a Bitcoin halving cycle.
BTC: Pi Cycle Top Indicator
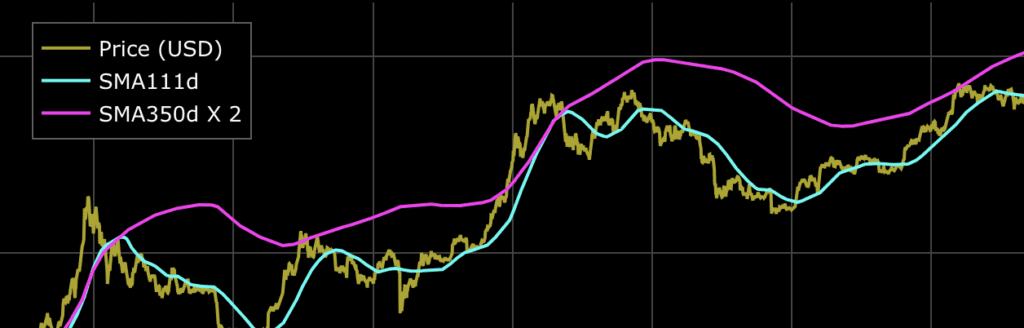
The Bitcoin Pi Cycle Top Indicator is a tool used by some to predict when Bitcoin reaches its top price boundary before falling to its fair market price as witnessed in prior cycles. The Pi Cycle Top indicator works by using two moving average indicators.
Short-Term Moving Average: This indicator uses a 111-day moving average (MA) of Bitcoin’s price.
Long-Term Moving Average: This indicator uses a 350-day moving average, which is then multiplied by a factor of 2. This is effectively a smoothed average of Bitcoin’s price over a longer period.
A potential top in Bitcoins price is given when the 111-day MA crosses above the 350-day MA multiplied by 2. This crossover suggests that the short-term price momentum is significantly higher than the long-term trend, which can indicate over-extension and may precede a price decline.
The Bitcoin Pi Cycle Top Indicator has been accurate at highlighting peaks in Bitcoins price within a margin of 3 days during previous cycles.
How The 2024 Bitcoin Price Cycle Is Different
Since a few months after the 2024 Bitcoin halving we have witnessed a sideways movement in Bitcoins price. This could be due to the approval of Bitcoin ETFs where we can see increased investment from institutional investors, media exposure and the increase in Bitcoin infrastructure making Bitcoin more accessible through trading platforms and improved security measures.
Many believe because of these events we are simply witnessing a longer Bitcoin price cycle with bullish volatility and price rising beginning towards the end of 2024. No one can truly predict the market which is why it is important to consider all outcomes and not assume that this cycle will be similar to the previous Bitcoin price cycles we have seen in the past.
Dollar Cost Averaging (DCA)
The safest way to invest in a market with uncertainty on future price action is Dollar Cost Averaging. With Dollar Cost Averaging you are purchasing periodically at set intervals and amounts. This allows purchasing something at its highs and lows killing volatility and averaging out investment costs.
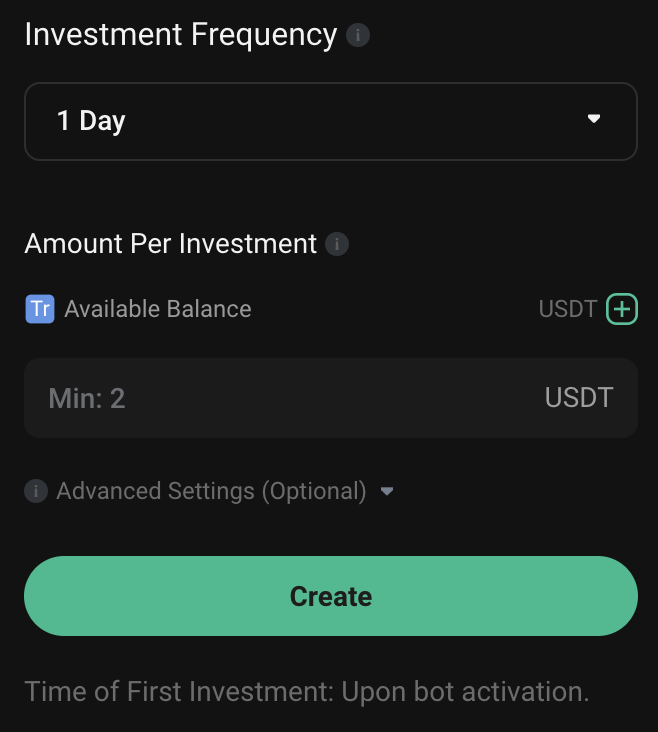
A practical suggestion is to create a DCA bot on KuCoin or another exchange and set a DCA bot to purchase Bitcoin in 1 hour or 1 day intervals.
If the price of Bitcoin was to tank here on you will simply be purchasing Bitcoin at opportunistic prices. If Bitcoin is to rise you will be purchasing the dips along the way reducing your risk compared to timing the market and purchasing all at once.
Altcoin Extended Volatility
If you are an investor with a greater risk tolerance you might find it interesting that Altcoins (any alternative currency to Bitcoin) often follow the price of Bitcoin but with greater volatility. This is to say that the peaks and dips are extended.
With this principle in mind you can invest in smaller market cap coins with the same market trends and timing as Bitcoin for exacerbated gains, but also exacerbated losses – if a coins price was to not recover, bear in mind.
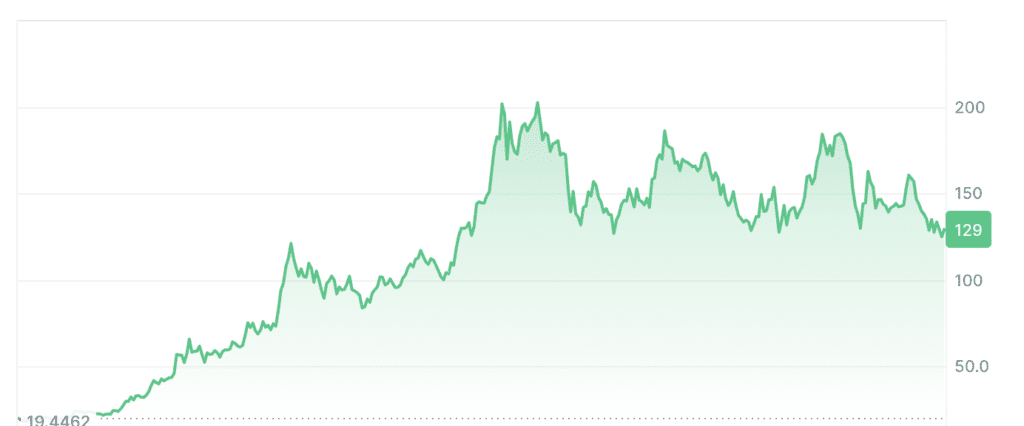
Above is an example of how Solana is tracing Bitcoins movement but with higher highs and lower lows. As it stands, in the last month, Solana is down 17.07% whereas Bitcoin is down 10.4%. There is more short term opportunity in buying Solana right now but there is more long term risk if you were to HODL (hold on for dear life) due to less certainty in the future outlook of Solana because of its smaller market cap.
Conclusion
Investing in cryptocurrency can be an exciting and rewarding investment but be prepared for volatility and extended periods of lows or highs. If your risk tolerance won’t allow you to invest all at once, consider Dollar Cost Averaging (DCA). Don’t making decisions based on FOMO and understand the current market situation with regards to upwards and downwards room. If you’re not sure on a market extend your horizon to 5 years and you will be better able to see where you would sit in the market right now if you were to invest. If there is one thing that you can conclude from this article it is that time in the market is always better than timing the market.